
Talks & courses · Talk
Beyond p < 0.05
The p-value is the most widely used metric for deciding whether a result "works", and the 0.05 threshold is often treated as a natural boundary. This talk shows that the p-value reflects the distribution of the data and the choices of the analyst, and can therefore mislead when read on its own.
Open the interactive presentation (Portuguese)
What we discuss
- What the p-value is, and the most common misinterpretations.
- Where 0.05 comes from, the evidence scale, and thresholds suited to each context, from exploratory studies to genomics.
- The p-value as a function of sample size: irrelevant differences become "significant" with a large n, and large effects go unnoticed with a small n.
- Type I and II errors and statistical power: why p > 0.05 in an underpowered study is inconclusive, not negative.
- Multiple comparisons, from the dead salmon in the MRI scanner to spurious correlations.
- Meta-analysis: when weak studies add up and when the synthesis misleads.
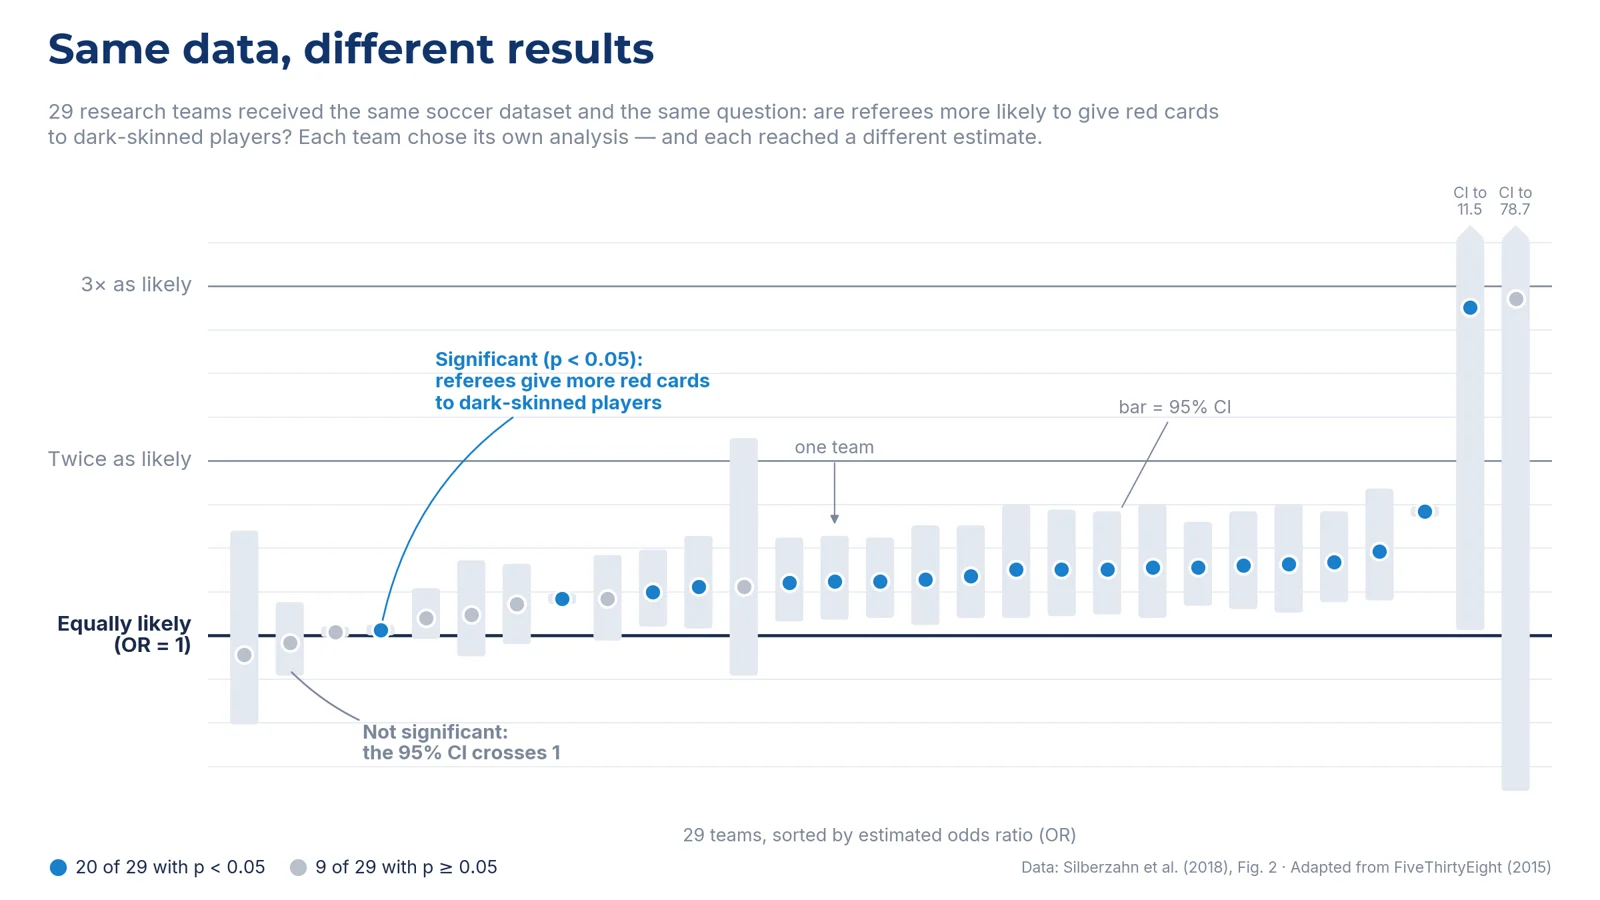
- Analytic flexibility: same data, different results.
- The American Statistical Association statement (2016) and good practices for reporting results.
Reproducibility
Every simulation in the presentation can be reproduced: each slide includes the corresponding R code.